Algorithm 1: MatchTemplate with Histograms
How to run:
Install dependencies and requirements
Import the script and run the main function
import mT_Hist
x, displacements, conversion_factors = mT_Hist.matchTemplate_hist("myfolder", "template.jpg", 0.70, wait=1, vis=False, plotting=False, csv=True)
Analyze csv or plot the return values with pyplot.
Main Function
The workflow of the main function is as follows:
Use the matchTemplate function.
Remove duplicated matches
Finding collinear matches
Calculating displacements in pixel with the help of histograms
Calculating a conversion factor from px to metric units with the help of histograms
-
mT_Hist.matchTemplate_hist(folder_path, template_path, thresh, wait=1, vis=False, plotting=False, csv=True)¶ Main function for Algorithm 1 (MatchTemplate with Histograms).
- Parameters
folder_path (str) – String with path to folder where the image series is located. can be an absolute or relative path
template_path (str) – String with path to the image that should be used as template (image of one single tape)
thresh (float) – Threshold for filtering matchTemplate. Recommended value is 0.7 - 0.75. See technical report for further info.
wait (int, optional) – waiting time between 2 consecutive images if the calculation is visualized in [ms]. default is 1 ms.
vis (bool, optional) – visualizes calculation (time-lapse with indicators). default is False
plotting (bool, optional) – plots the calculation in real-time (parallel to vis). default is False. Note that real-time displacements are before post-processing, so smoothing of conversion factors with convolution is not applied yet! Requires PyQt5 library
csv (bool, optional) – saves all output data into a csv file. default is True
- Returns
x-axis (list of float) – time values in hours for every image
total_displacement (list of float) – total cumulative displacements for every image in cm. same length as x-axis
smooth_scales (list of float) – distances between two tapes in px for every image. same length as x-axis
Important instructions for the template image
The template is an image of one tape. This template is then used to detect and track all tapes in the whole time series. Therefore, the chosen template can have a considerable impact on the results. Generally, the following criteria should be met to generate good results:
The represented tape should have a high contrast to the background (no white, grey, yellow)
The represented tape should have a high saturation (no white, black, grey, dark blue)
The represented tape should be located in the middle of the pole, so the distortion differences are minimized.
The template should contain a small margin on all edges
The size of the represented tape must be the same as in the original image. It is recommended to create the template by cropping a full image, so there is no resizing.
The represented tape should be in the center of the template image (no offset), so that underestimates resp. overestimates are reduced
Simply put, the template should be as representative as possible compared to all tapes, all images, all exposures. If the pole is always inclined for the whole time series, the tape on the template should be inclined as well. Ideally, the color of the tape in the template is red, because the contrast as well as the saturation is high.
Some examples for good templates:
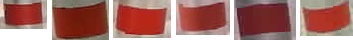
Examples for good templates. There is enough margin around the tapes, there is good saturation and contrast present.
The following images show some bad examples for templates:
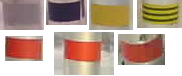
Top row (left to right): low saturation/contrast, too dark and no saturation, good saturation but no contrast, texture filling. Bottom row (left to right): not enough margin, too much margin, distorted tape (too low on the pole)
Important instructions for the image series
The whole time series is a set of images in a folder. This folder is given the function as an input. The following criteria should be met:
The filenames must be timestamps in the following format: yyyy-mm-dd_hh-mm (e.g. 2019-06-27_11-59.jpg) other image file types are also allowed.
The algorithm is tested and optimized for time intervals of 20 minutes between images. Different intervals are generally possible (yet untested), but the displacements between two images must not exceed 4 cm.
Footage from installation work at the beginning of the time series must be removed. The first image should only contain the installed pole.
The initial position of the pole should preferably cover already the whole image height and not only the very bottom.
Displacements during data gaps with more than 4 cm displacement will not be calculated correctly and have to be added manually.
Important instructions for the chosen threshold
The threshold filters results from the matchTemplate function comparing target image and template. Sub-areas of the target image with a correlation value higher than the threshold are considered a match and are used for further calculations. Some remarks:
The algorithm has proven to work best for thresholds between 0.7 - 0.75
It is recommended to run the program several times with different thresholds. This makes it very easy to detect outliers and calculation errors.
Higher thresholds may lead to a loss of correlation and termination of the program if there is a longer period of bad quality images (e.g. snowfall)
Lower thresholds may lead to higher instability of the algorithm (wrong displacement calculations)
Sub-functions
The following functions are called by the main function. Those functions are not intended to use individually. The documentation is therefore purely for a better understanding of the main function.
Removing Duplicates
-
mT_Hist.remove_duplicates(points)¶ This function is approximating points that are very close together into 1 single point. If 2 or more points are close together (defined by a threshhold in px), the average x and y coordinates of all those points determine the result point.
- Parameters
points (list of tuple of float) – list of x and y coordinates e.g. [[x1, y1], [x2, y2], …]
- Returns
points – list of x and y coordinates of fewer points.
- Return type
list of tuple of float
Finding Collinear Matches
-
mT_Hist.find_collinear(points)¶ This function searches for points that are collinear (on 1 straight line). If there are several lines, the one with the most points on it is chosen.
- Parameters
points (list of tuple of float) – list of x and y coordinates e.g. [(x1, y1), (x2, y2), …]
- Returns
collinear_points (list of tuple of float) – list of coordinates of all matches that are collinear (on a straight line)
angle (float) – the inclination of the pole. returns 0 if no collinear matches.
Calculating Displacements
-
mT_Hist.get_distance(newmatches, oldmatches, angle)¶ Detects the most common distance between 2 sets of points. This function is beneficial because all tapes on the pole are supposed to move the same amount of distance between 2 frames. Therefore, if as input all matches in the old frame and all matches in the new frame are chosen, the most common distance between all combination of points will be the displacement of the pole. To be more precise, the distance projected to the pole is calculated (hence the pole inclination as input).
- Parameters
newmatches (list of tuple of float) – List of point coordinates (x, y)
oldmatches (list of tuple of float) – List of point coordinates (x, y)
angle (float) – The inclination of the pole (retrieved with the find_collinear function)
- Returns
bin_lower (float) – lower limit of where the most common displacements were found.
bin_upper (float) – upper limit of where the most common displacements were found.
-
mT_Hist.compare_matches(matches, inclination, delta)¶ This function compares the last two sets of points in a whole time series of points and calculates the displacement between those. If no displacement can be calculated, it recursively tries to compare earlier points with the current one.
- Parameters
matches (list of tuple of float) – A 2d list containing several points for each time step. e.g. [[[x11, y11], [x12, y12]], [[x21, y21], [x22, y22]]]
inclination (float) – Inclination angle of the pole in rad
delta (int) – difference between the positions of the images that are compared. default is 1 (last image compared to second last). delta is used to recursively iterate through past images to find good matches.
- Returns
displacement (float) – displacement between the frames in px.
delta (int) – end point of the recursive iteration. shows to which frame the last frame was compared to. Example: If the last frame is compared to the second last delta = 1. delta is used to calculate the total displacement in a later step of the algorithm. The information is needed, so that the found displacement of the current time step can be added to the correct value of the cumulative displacement.
Calculating Conversion Factor
-
mT_Hist.get_scale(points, scale_array)¶ Gets the most common distance between all matches in 1 frame, Which corresponds to the distance between 2 tapes.
- Parameters
points (list of tuple of float) – list of all matches in a frame
scale_array (list of float) – list of float numbers of scales from previous frames, so an average can be calculated
- Returns
scale – the distance between 2 tapes in px.
- Return type
float
-
mT_Hist.clean_scales(daily_disp, conversion_factors, boxlength)¶ This function makes the calculated conversion factors smoother by applying a convolution function (floating average). This way, outliers (errors) are removed. From the smoothened conversion factors and displacement rates, a new cumulative displacement array is calculated.
- Parameters
daily_disp (list of tuple of float) – list of displacement rates between frames. The first value is the displacement in px, the second value is the relative index to wich image the current one was compared with (this is needed for calculation of cumulative displacements) Example: if the displacements of the current frame was calculated by comparing the current frame with the previous one, the index is 1. If the previous frame did not contain any matches and the displacement was calculated by comparing the current frame with one frame earlier than the previous the index is 2.
conversion_factors (list of float) – list of calculated distances between two tapes from every frame. Same length as daily_disp
boxlength – amount of values that should influence the floating average. Must be smaller than half of the length of conversion_factors.
- Returns
clean_displacements (list of float) – list of cumulative displacements between frames in cm with smoothened conversion factor
scale_smooth (list of float) – smoothened conversion factors after convolution
-
mT_Hist.px_to_cm(px, ref_cm, ref_px)¶ Converts a number from px to cm according to a defined scale.
- Parameters
px (float) – distance in px that is to be converted.
ref_cm (float) – reference distance in cm (e.g. distance between 2 tape stripes).
ref_px (float) – reference distance in px (same reference as ref_cm)
- Returns
distance – converted distance in cm.
- Return type
float
Other functions
-
mT_Hist.load_images_from_folder(folder)¶ function loading all image files inside a specified folder. File names must contain date and time with delimiters - or _
- Parameters
folder (string) – path of the folder (string). can be a relative or absolute path.
- Returns
images (list) – list of opencv images
times (list of float) – list of time differences to the first image in hours. e.g. [0, 0.5, 1.0, …]
-
mT_Hist.draw_rectangle(image, points, w, h, color, thickness)¶ Draws a rectangles for a set of points. This function is mainly for visualizing and debugging purposes.
- Parameters
img (opencv_image) – The image where the recangles should be drawn
points (list of tuple of float) – set of x and y coordinates. e.g. [(200, 100), (120, 150), …]
w (int) – width of the rectangles
h (int) – height of the rectangles
color (tuple of int) – color tuple in BGR
thickness (int) – thickness of the drawn rectangle borders